AlTiS-NG Wiki
1 Welcome to AlTiS-NG
AlTiS-NG is a powerful tool for processing altimetry data. This documentation will guide you through the installation, setup, and usage of AlTiS-NG.
1.1 Getting Started
1.1.1 Download AlTiS-NG
AlTiS-NG is available for Windows and Linux. It is standalone software provided as a binary package, ready to run on your platform without any installation procedure. The current version of AlTiS-NG is available in the CTOH catalog : http://dx.doi.org/10.6096/3007.
Alternatively, you can choose to download the source code and compile it yourself.
Download AlTiS-NG for your platform :
The current version of AlTiS-NG is v1.0.
Simply log in to the CTOH Catalog and navigate to the download tab to access it.
| Platform | Binary File |
|---|---|
| Windows 10 | altis-gui_vx.x_windows-10.zip |
| Windows 11 | altis-gui_vx.x_windows-11.zip |
| Ubuntu 22.04 | altis-gui_vx.x_ubuntu-22.04.zip |
| Ubuntu 24.04 | altis-gui_vx.x_ubuntu-24.04.zip |
1.2 Altimetry Products
AlTiS-NG utilizes official Level-2 altimetry data products (Geographical Data Record - GDR) provided by space agencies such as ESA, NASA, and CNES. To enhance the performance of the AlTiS software, the CTOH distributes reduced GDR data files derived from the official products. These files are specifically conditioned to optimize data size through geographical selection and include the appropriate altimetry parameters for hydrological studies.
To request these reduced altimetry products tailored for AlTiS:
- Fill out the request form.
- The product is supplied in a ZIP archive.
- Once downloaded, you can directly load it into AlTiS without extracting the ZIP archive.
AlTiS-NG is compatible with products from historical missions such as Topex, Jason-1/2/3, Envisat, as well as current missions like Sentinel-6 and SWOT nadir.
| Mission | Product Name | Cycles | Dates | Version/Product Reference | Orbit Phase |
|---|---|---|---|---|---|
| Topex | tpx_a_cash_d_gdr | 10-359 | 1992/12/21 to 2002/06/22 | CASH product (available soon) | Nominal Jason orbit |
| ERS-2 | ers2_a_ctoh_v0100_gdr | 1-89 | 1995/05/17 to 2003/11/24 | CTOH product | Nominal ERS orbit |
| ENVISAT | env_a_esa_v0300_sgdr | 6-94 | 2002/05/14 to 2010/10/21 | Reprocessing ESA v3.0 | Nominal ERS orbit |
| Jason-1 | ja1_a_cnes_e_gdr | 1-259 | 2002/01/15 to 2009/01/26 | GDR-E | Nominal Jason orbit |
| Jason-2 | ja2_a_cnes_d_sgdr | 0-303 | 2008/07/04 to 2016/10/02 | GDR-D | Nominal Jason orbit |
| SARAL | srl_a_cnes_f_sgdr | 1-35 | 2013/03/14 to 2016/07/04 | GDR-F | Nominal ERS orbit |
| CryoSat-2 | cs2_b_gop_c_gdr | 1-10 | 2010/10/01 to 2021/12/31 | Baseline C | Annual orbit (drifting) |
| CryoSat-2 | cs2_b_ice_d_gdr | 1-10 | 2010/10/01 to 2021/12/31 | Baseline D | Annual orbit (drifting) |
| Jason-3 | ja3_a_cnes_f_sgdr | 0-227 | 2016/02/12 to 2022/04/07 | GDR-F | Nominal Jason orbit |
| Jason-3 | ja3_b_cnes_f_sgdr | 300- | 2022/04/25 to present | GDR-F | Interleaved Jason orbit |
| Sentinel-3A | s3a_a_hydro_bc5_sgdr | 5- | 2016/06/15 to present | Baseline C.005, Hydro Thematic Prod. | Nominal Sentinel-3A orbit |
| Sentinel-3B | s3b_b_hydro_bc5_sgdr | 20- | 2018/08/15 to present | Baseline C.005, Hydro Thematic Prod. | Nominal Sentinel-3B orbit |
| Sentinel-6A LRM | s6a_a_lrm_%_gdr | 4- | 2021/05/21 to present | Baseline F06 and F07 | Nominal Jason orbit |
| Sentinel-6A SAR | s6a_a_sar_%_gdr | 4- | 2021/05/21 to present | Baseline F06 and F07 | Nominal Jason orbit |
| SWOT nadir | swot_b_nadir_f_sgdr | 1- | 2023/07/21 to present | GDR-F | Nominal science SWOT orbit |
1.3 Products Configuration File
AlTiS-NG configuration file of products is available here.
2 Graphical User Interface
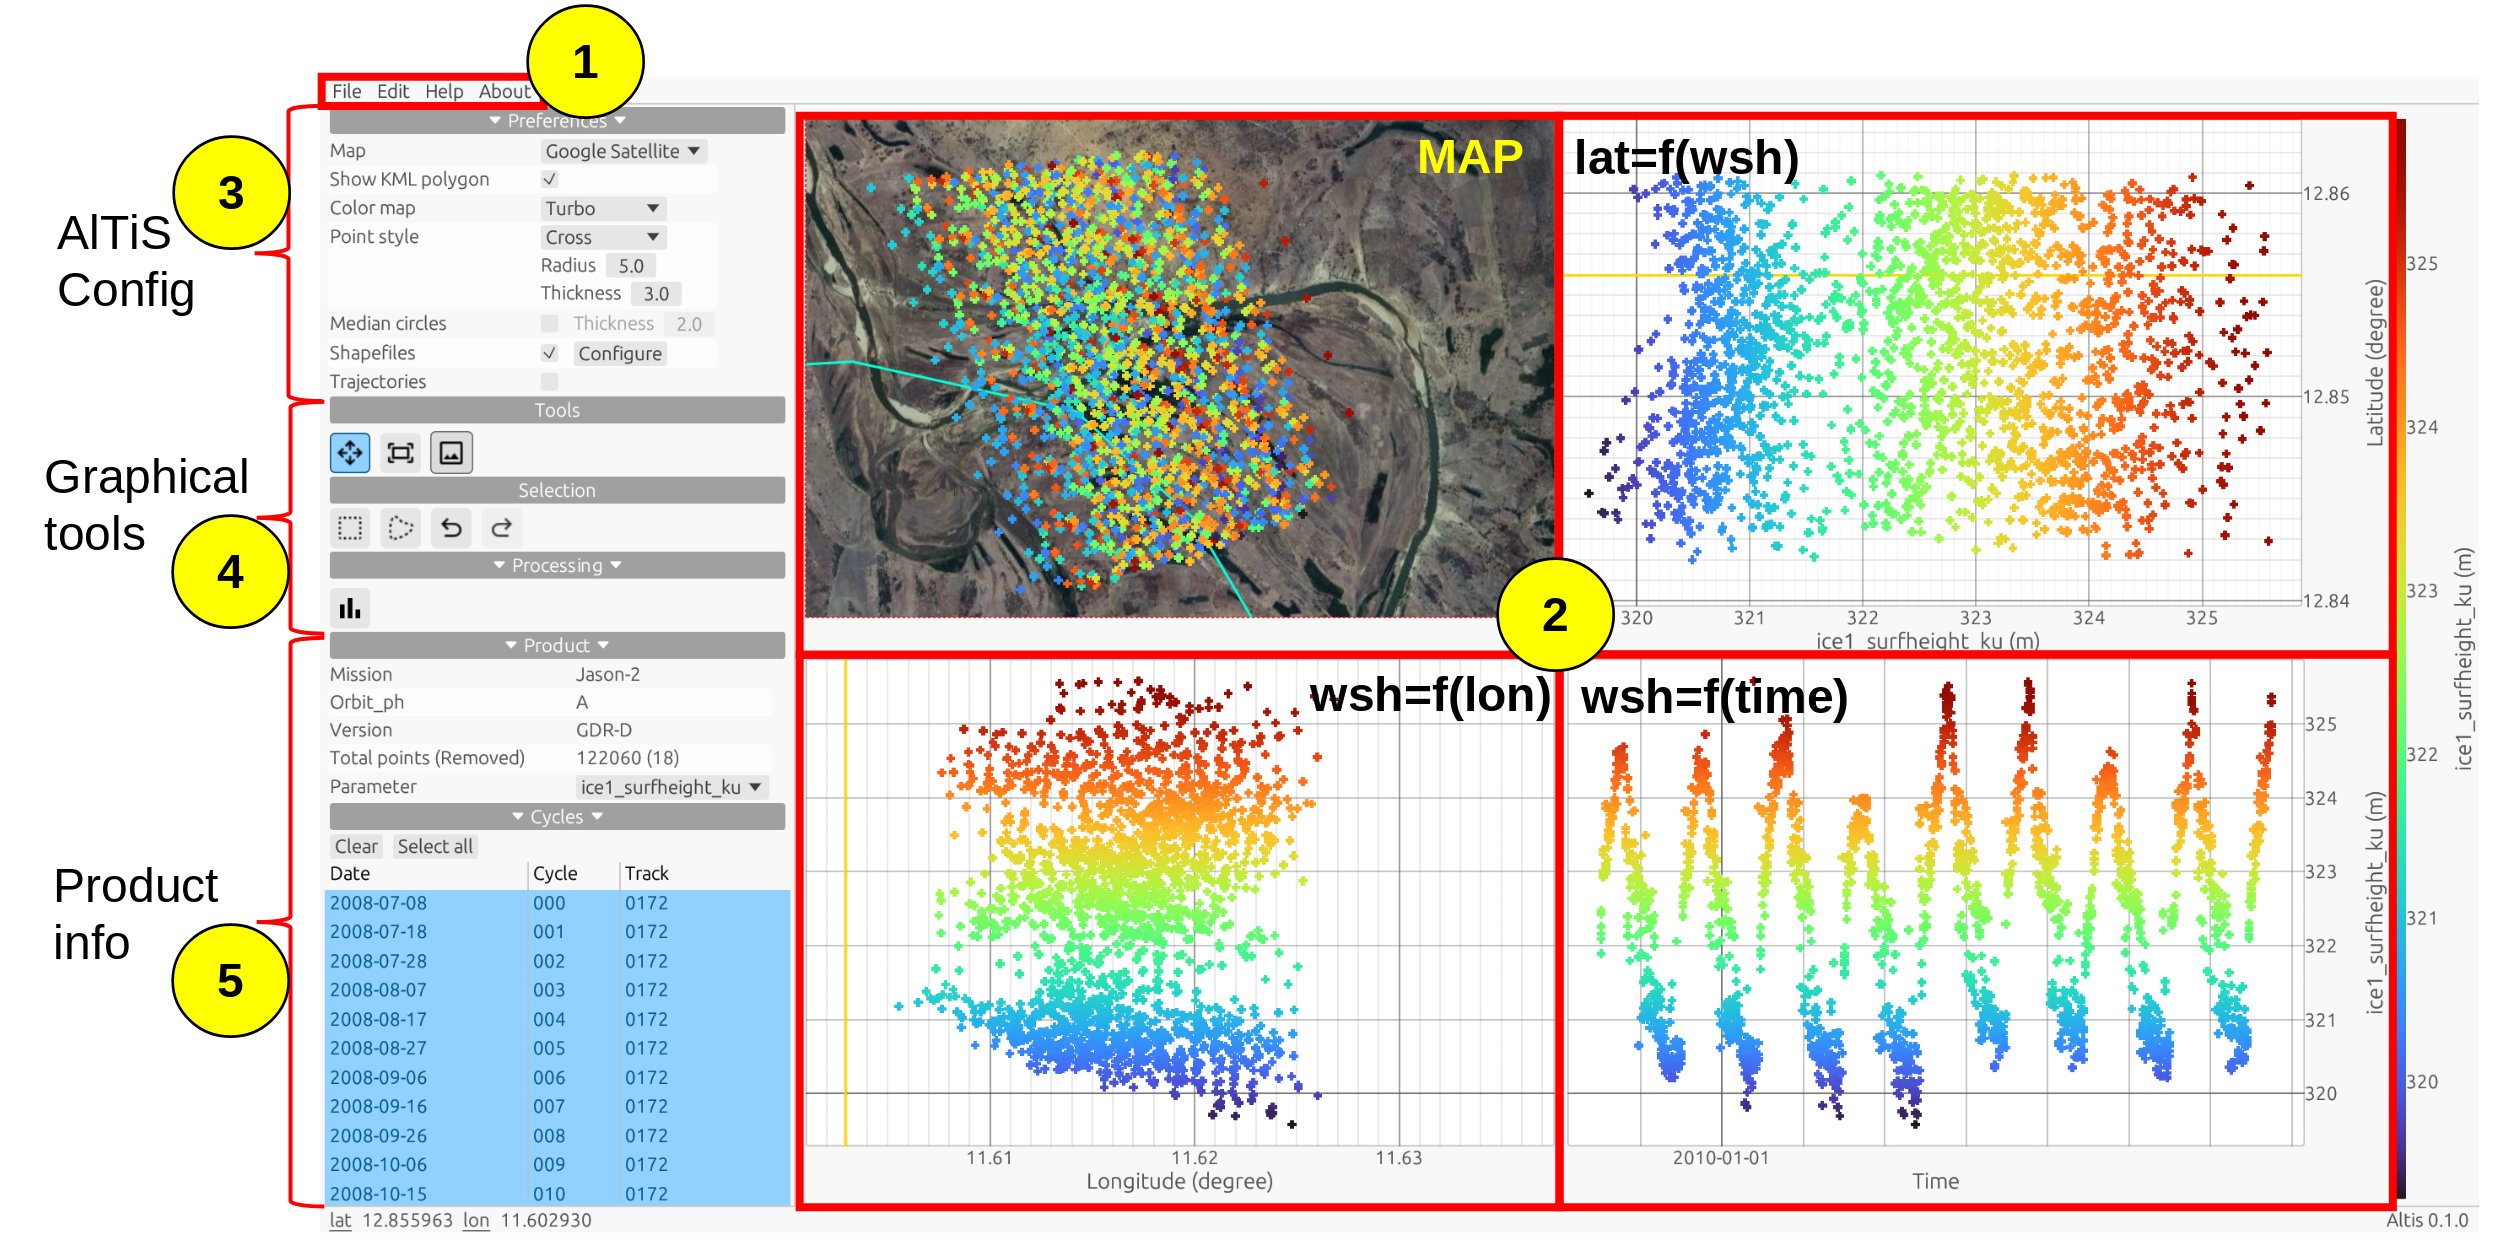
The main AlTiS-NG GUI consists of five components:
2.1 Menu Bar
The Menu Bar provides access to initiate processing, configure the GUI, and access help resources.
2.1.1 File Menu
The File menu offers options to start and exit the AlTiS processing.
- To begin AlTiS processing:
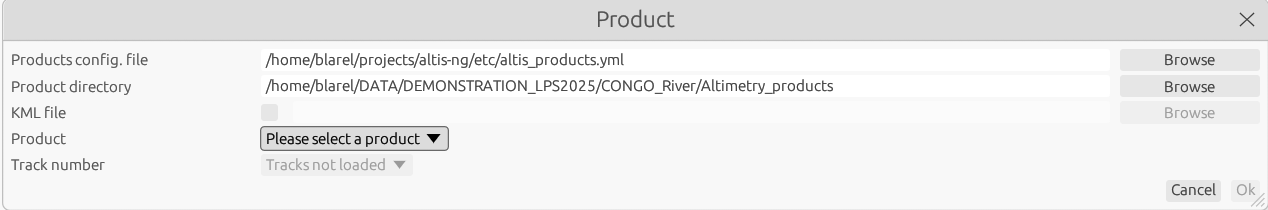
- Load the altimetry products by selecting File > Product.
- In the Product window, select the product directory containing the ZIP files retrieved from the CTOH. AlTiS will automatically recognize the products within.
- Set a Google Earth polygon to preselect data within the study area.
- Choose the product from the selection list and track below.
- Confirm your selection by pressing OK.
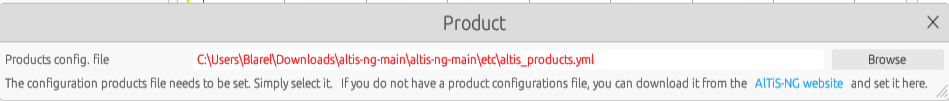
For first-time users of AlTiS, the altis configuration file (altis_products.yml) must be set first in AlTiS Configuration.
Do not extract products ZIP archive. AlTiS-NG operates directly with product ZIP archives.
- To exit AlTiS: Select File > Quit.
2.1.1.1 Edit Menu
The Settings menu is for configuring AlTiS.
- Zoom: To apply zoom to GUI display.
- Preferences: To set general and map preferences.
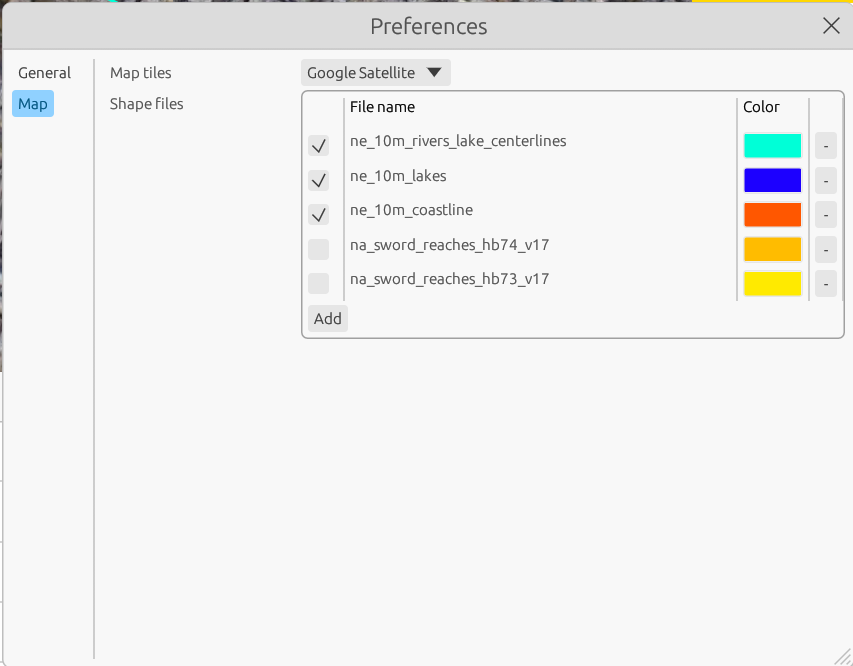
In the Preferences window, under the Map tab, you can customize the basemap MapTile for your map view. Below are the basemap services available:
| Basemap Service | Options |
|---|---|
| Esri | World Imagery, World Terrain, World StreetMap, World Topographic, World Relief, etc. |
| Google Maps, Google Satellite, Google Terrain, Google Satellite Hybrid, etc. | |
| Other | Sentinel-2 cloudless, etc. |
You can enhance your basemap by overlaying shapefile layers that include features such as rivers, lakes, and coastlines. To do this:
- Retrieve the desired shapefile features from the Natural Earth website.
- Click on Add to select the shapefile.
- Choose the display color for the shapefile.
2.2 Map and Plots Views
The AlTiS GUI is composed of 4 plots (refer to number 2 in the AlTiS GUI Figure 2), which share common X- or Y-axes:
- Top Left: Map of the study area. Longitude versus Latitude map of the study domain, showing altimetry data points.
- Top Right: Graphical projection of the altimetry data as a function of latitude coordinate: \(lat=f(wse)\)
- Bottom Left: Graphical projection of the altimetry data as a function of longitude coordinate: \(wse=f(lon)\)
- Bottom Right: The raw time series: \(wse=f(time)\)
2.3 Configuration Tab
On the left-hand side, you can find the Preferences Tab (refer to number 3 in the AlTiS GUI Figure 2). This tab contains various preference parameters that are also accessible through the Settings > Preferences menu, such as basemap settings. Additionally, you can adjust parameters for plot figures, including color, point style, and marker size.
Within this tab, you can configure the display of the median value of parameter (Median points), which indicates the position of the selected altimetry measurement (red circles), as well as the trajectories of each satellite cycle pass. You will also find shortcuts to configure the display of the shapefile in the Settings > Preferences menu.
2.4 Graphical Tools Tabs
The Graphical Tools tabs (refer to number 4 in the AlTiS GUI Figure 2) consolidate various graphical tools. These tools are categorized as follows:
| Tab | Description |
|---|---|
Map Navigation 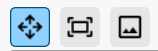 |
Tools for moving and centering the map on the data selection, with a screenshot button to export a view (png) of the current selection. |
Data Selection 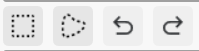  |
Tools for selecting data using rectangular or polygonal windows, including buttons to undo and redo selections in case of errors. There arealso two buttons to save the graphical selection into the product and to retrive it in a next |
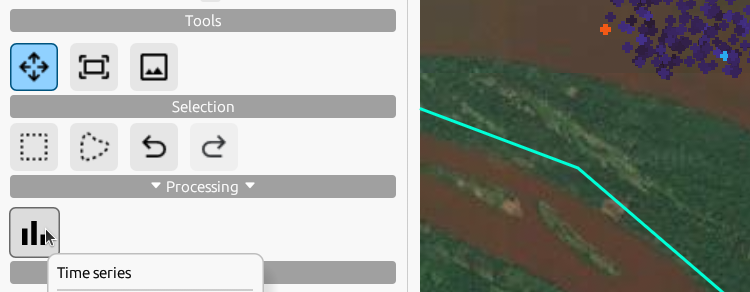
Time Series   |
A button to create a time series from the current selection. There are also buttons to export convex hull of the geographical selection as KML/KMZ. |
2.5 Product Information Tabs
The product information section consists of two tabs.
Product Tab: Provides details about the loaded product, including the mission name, orbit phase, product version, etc. This tab also includes the Parameter field, which is for displaying altimetry surface height computed by AlTiS, along with a list of parameters included in the loaded product. After loading the product, you must select one of these parameters from the list to display it and start the processing.
Cycle Tab: Helps you select the cycle(s) of the track to display. You can choose one or multiple cycles by holding down the Ctrl key while clicking on the different cycles. This feature is useful for analyzing data cycle by cycle.
3 Creating Time Series with AlTiS-NG
This guide will walk you through the process of creating time series step by step using the AlTiS-NG software.
3.1 Loading Altimetry Data Products
Once you have retrieved your altimetry products from the CTOH (ZIP archive) on your computer, loading the altimetry data product is the first step to start using AlTiS.
- In the File > Product menu, select the product directory for the Product directory field containing the ZIP files retrieved from the CTOH. AlTiS will automatically recognize the products within.
- Select the Product from the selection list and choose the Tracks to process.
- Press Ok to load it.
For first-time users of AlTiS, the altis configuration file (altis_products.yml) must be set first in AlTiS Configuration.
The radar altimetry products are supplied into ZIP archives. Do not decompress it. AlTiS-NG operates directly with product ZIP archives.
To save computer memory, you can preselect data products for a reduced area. To do this, create a Google Earth polygon (KML or KMZ file) for your reduced study area and choose the KML file option to apply the polygon as a preselection mask.
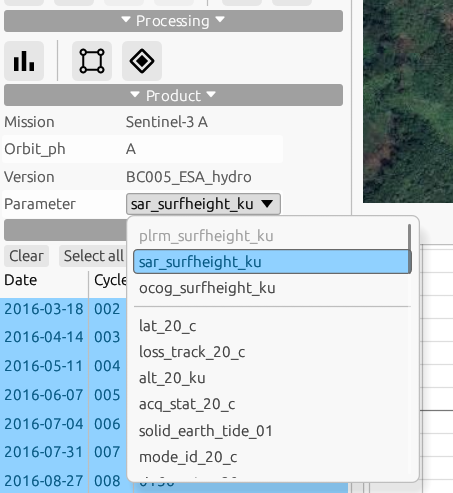
3.2 Parameter Selection
Once the altimetry data product is loaded, you need to choose the parameter to display:
- In the Product tab, there is a Parameter field which is a selection list of parameters available for display. The selection contains the surface height parameter computed by AlTiS and the list of native product parameters.
- To create a time series of WSE, you must choose the surface height parameter at the top of the list (named with surfheight).
The data of the parameter is displayed on the 4 plots of the AlTiS GUI.
What is the water surface elevation parameter? In the parameter list, computed altimetry water surface elevation parameters have names following the pattern surfheight. The prefix name refers to the retracker name (OCOG, ICE-1, SAR, ocean, etc.) and the altimeter radar band.
Which retracker for water surface elevation? For continental surfaces, the OCOG or ICE-1 retracker is a good first choice. However, the surface height must be validated with care due to the complex interaction of the radar wave with the ground surface. In most hydrological cases, OCOG, ICE-1, and SAR retrackers are used. For other purposes such as coastal altimetry and ice land, the retrackers are more specific and require a strong understanding of measurement physics to assess the results.
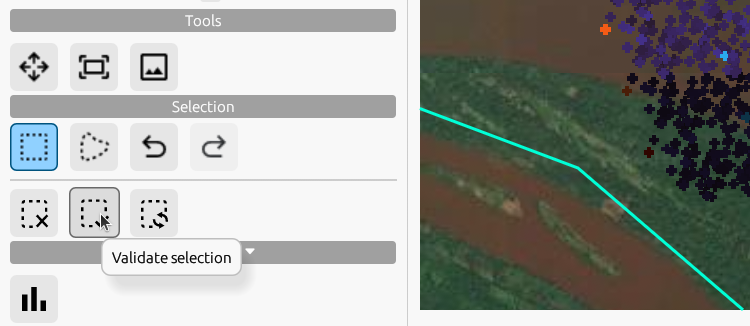
3.3 Graphical Selection
Once the parameter is displayed, the graphical selection of the data is available:
- From the selection tab, you have a choice of rectangular or lasso selection tool. Click on one of the buttons to start the selection process.
- In one of the GUI 4 plots, use the mouse to click and drag around the data points to select them and release the click.
- The color display of the unselected points is dimmed, and you can validate or remove the data selection.
- To abort the selection process, simply click on the undo button.
This selection process can be repeated as needed.
How to save my data selection? Simply click on the save button.
3.4 Time Series
Once the graphical selection is complete, the time series can be generated:
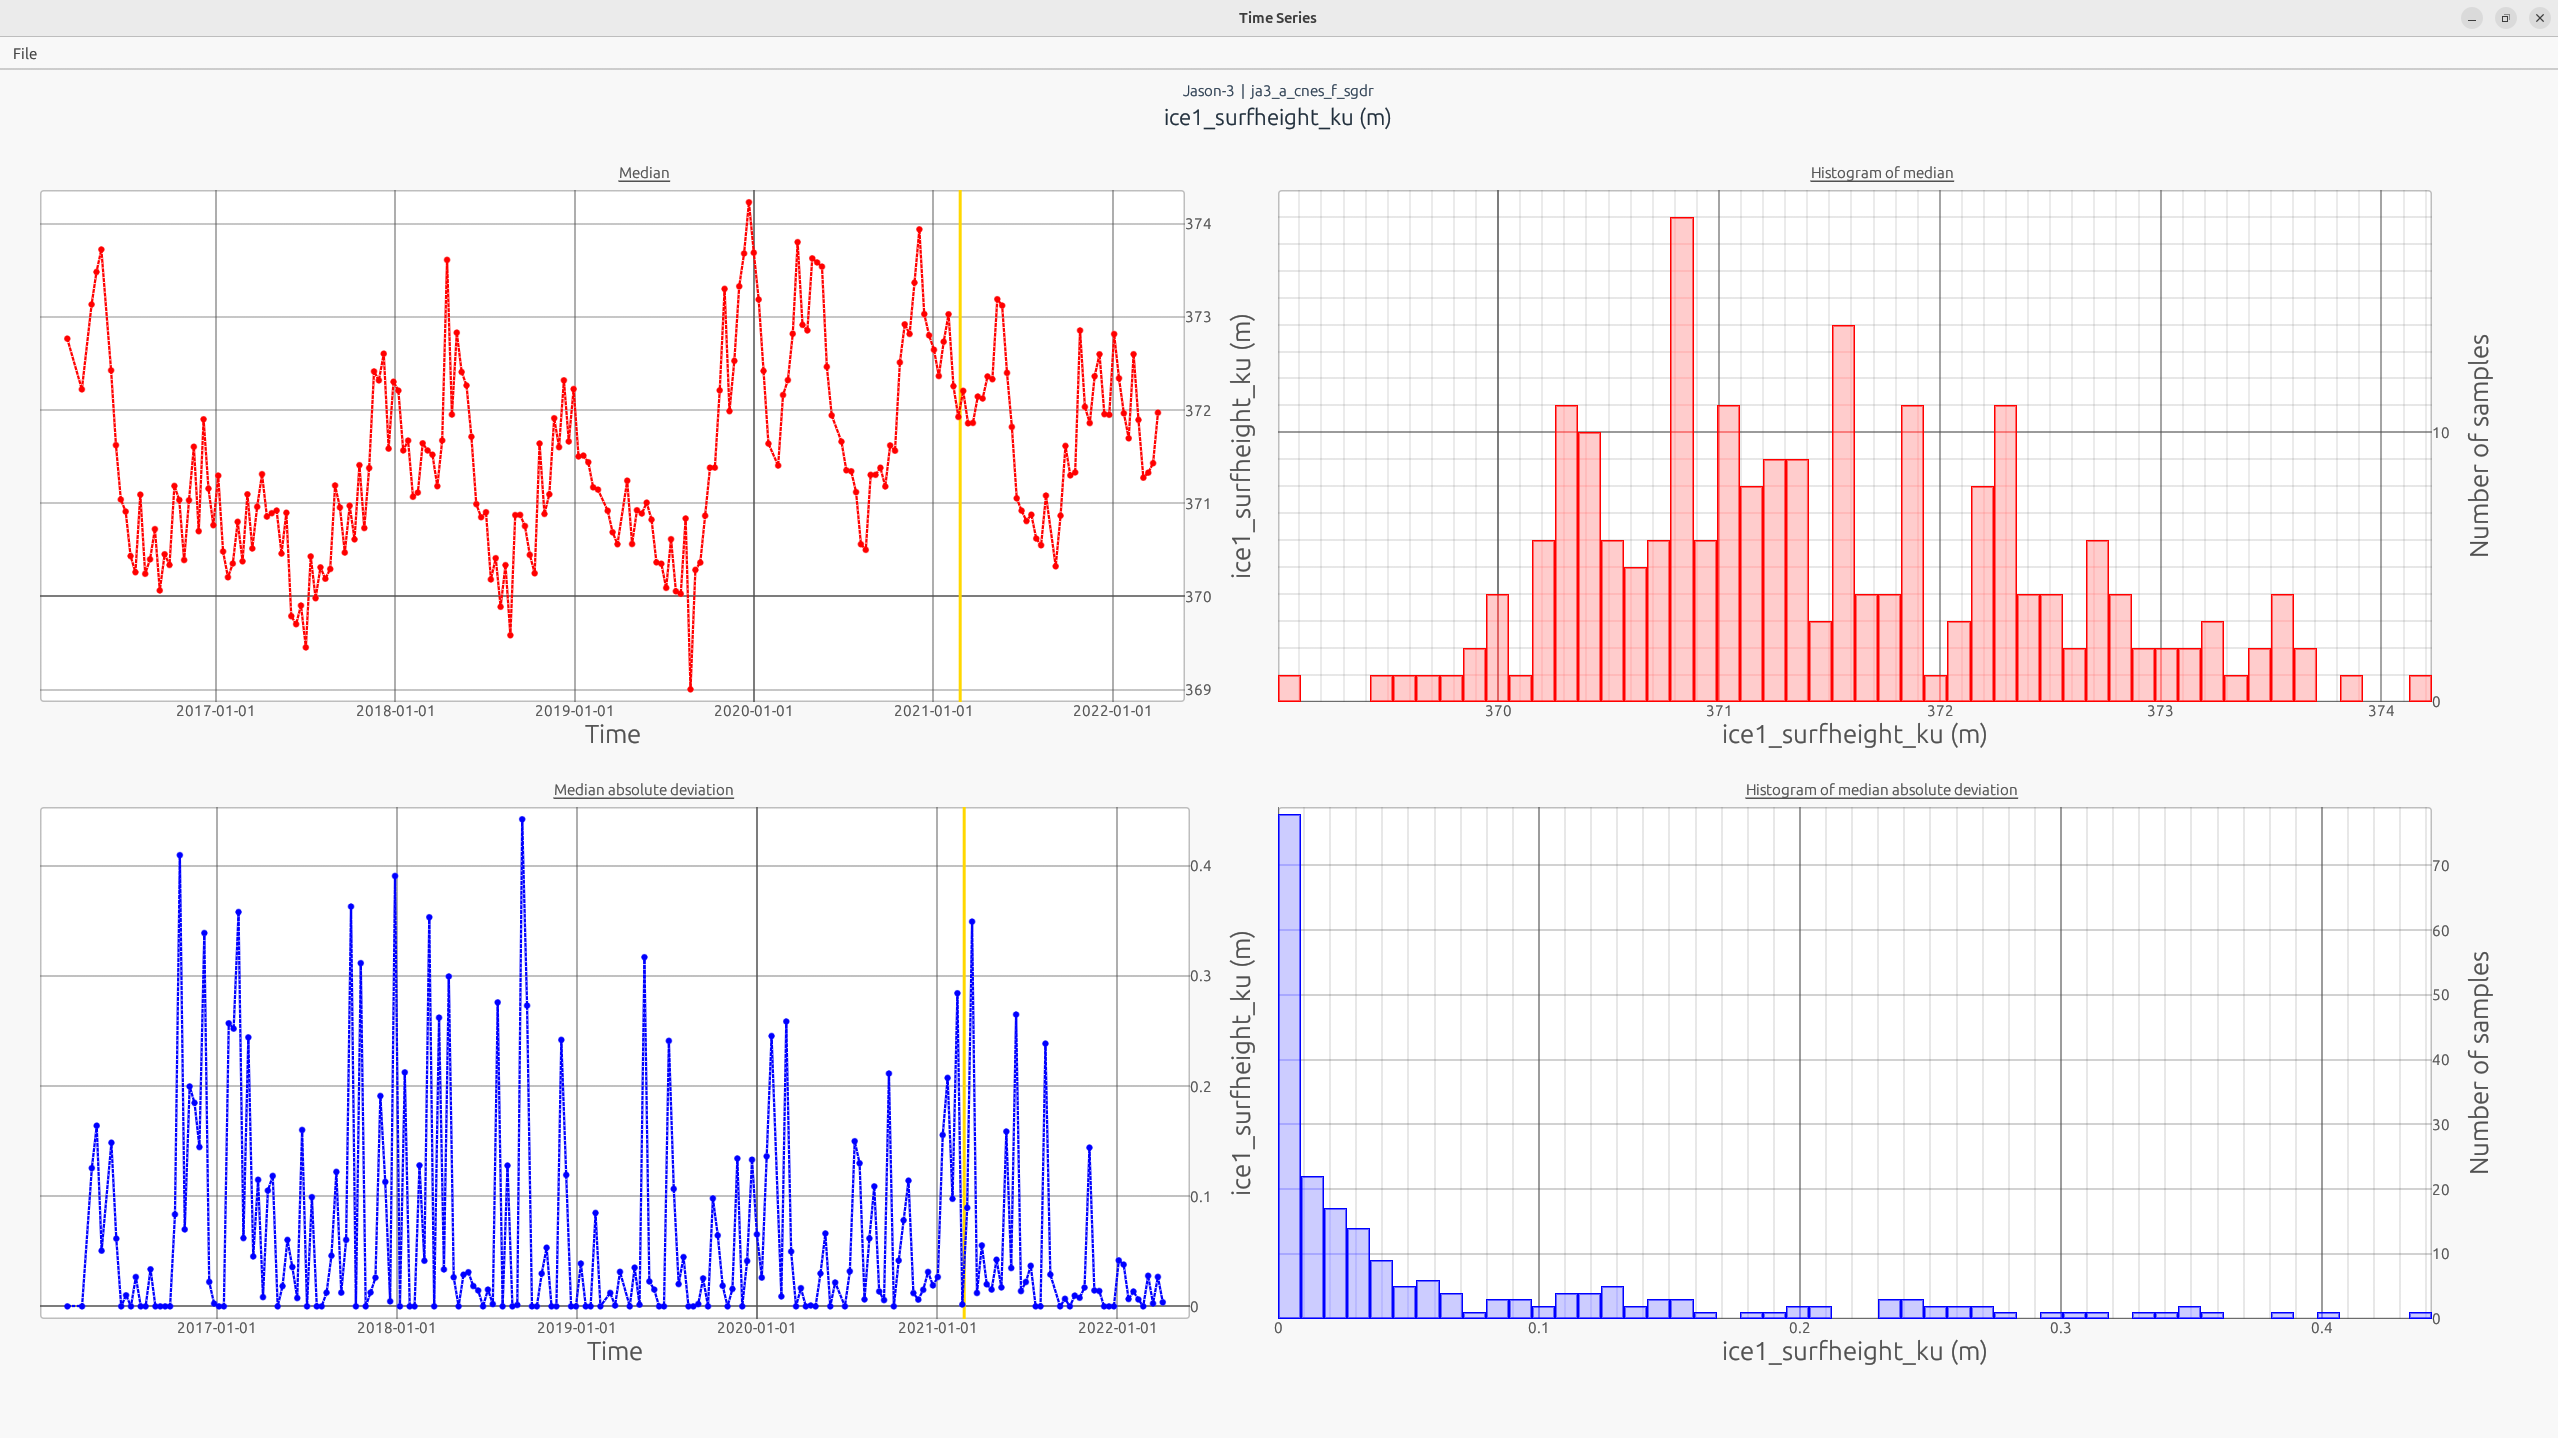
- From the time series tab, click on the Time Series button. A new window appears with 4 plots.
- The top row plots show the median value (red) of the parameter. On the left-hand side is the time series, and on the right-hand side is the distribution.
- The bottom row plots show the Median Absolute Deviation value (blue) of the parameter. On the left-hand side is the time series, and on the right-hand side is the distribution.
How to improve the time series? If there are outliers in the time series, it can be improved by removing the remaining parasite measurement points. Just close the time series window, make another graphical selection, and check the time series iteratively.
3.5 Export Time Series
Once the time series is complete, it can be exported.
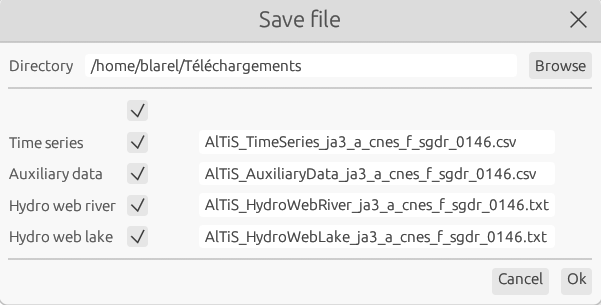
- In the time series window, click on Export.
- The file format to export the time series is CSV or HydroWeb.
- Time series is the basic export of the WSE time series.
- Auxiliary data is a complementary export with all parameters used to compute the WSE time series if needed to check or analyze parameters.
- The CSV files can be opened in spreadsheet software.
4 Data selection
AlTiS-NG allows you to export and save your data selections.
4.1 Save data selection
AlTiS-NG save the entire selection mask directly into the original product. This is done by creating a variable called altis_selection_mask within the netCDF files. With just a simple click on the save button, your selection mask is stored.
When you need to restore the selection mask after loading the product, AlTiS applies it automatically. All you have to do is press the restore button.
4.2 Export convex hull
AlTiS-NG enables you to export the convex hull of the geographical contour of your selection. This feature is designed to handle multiple missions on the same orbit within a single study area. Just click the Export Convex Hull button, and a KML/KMZ file will be generated. To reuse the convex hull as selection polygon, first load the parameter and then import the KML/KMZ file to apply it to the loaded parameter.